Sunday, May 11, 2025
Improved Mortality Model Update
[covid retrospective ; boring]
Follow-up to my prior post:
I was curious whether the kink in the death factor around 1950 was a real property of the data or just an artifact of the cutoff date (i.e., of when the peak death ages started hitting the end of the data). The latter might imply the large scale slopes of the birth-year and death-year curves were just compensating for something poorly measured by either.
So I retrained Norway, which had the most pronounced bend, only up to 2000 to see if the bend also shifted back 20 years:
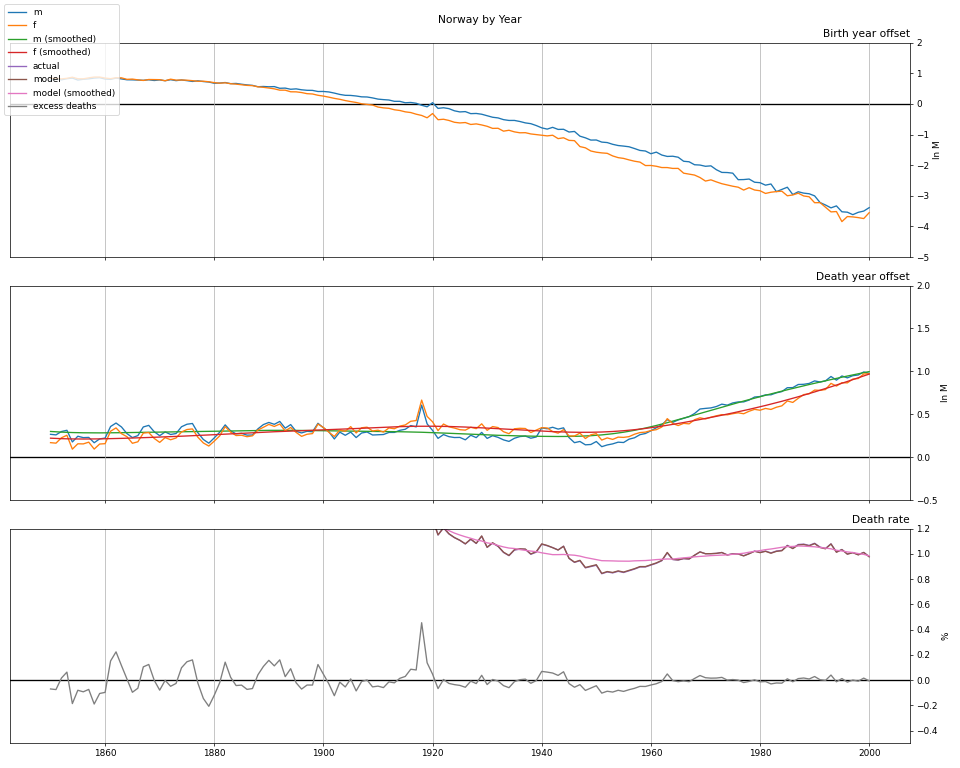
vs. the original:
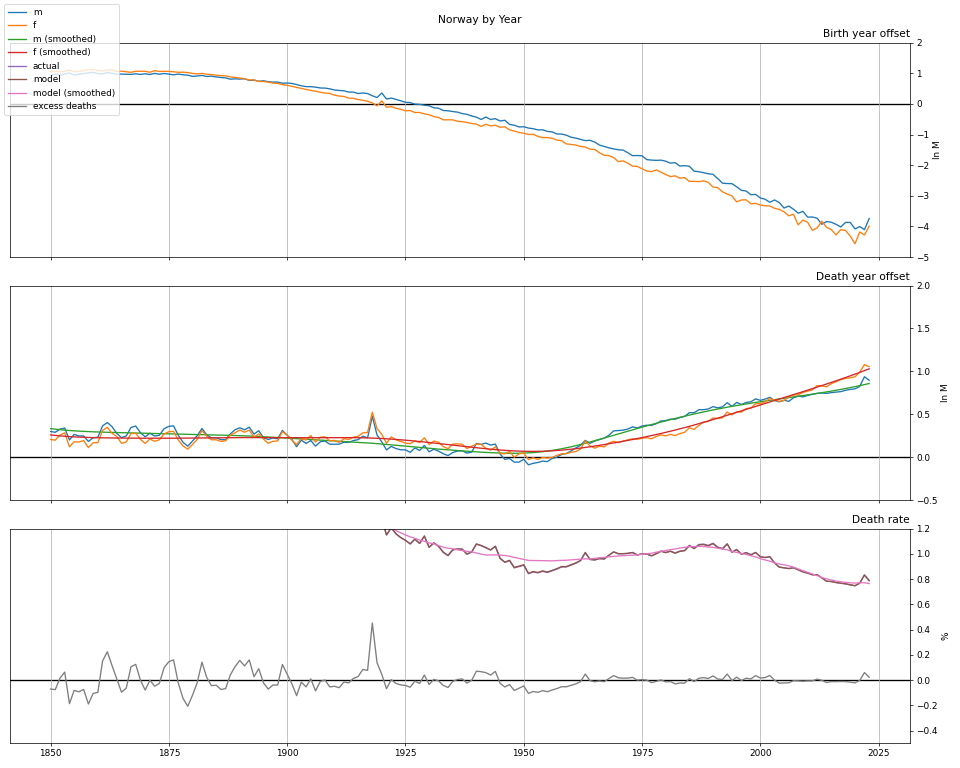
So, nope! The bend appears to be real. Which is kind of weird and interesting, and not immediately obvious to me what it implies.
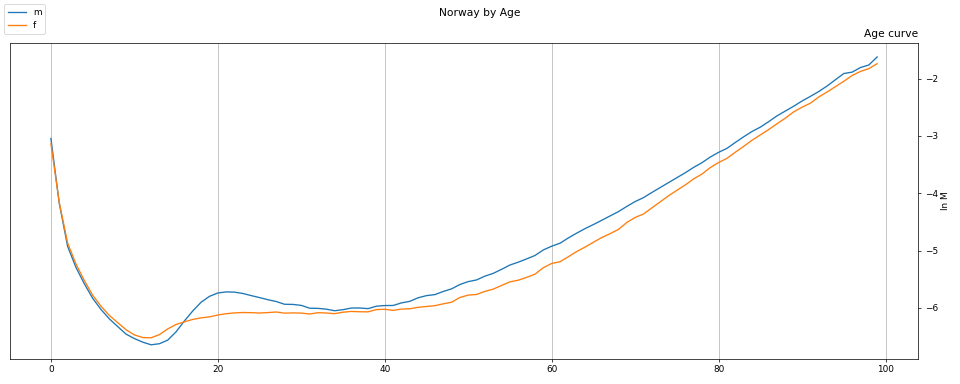
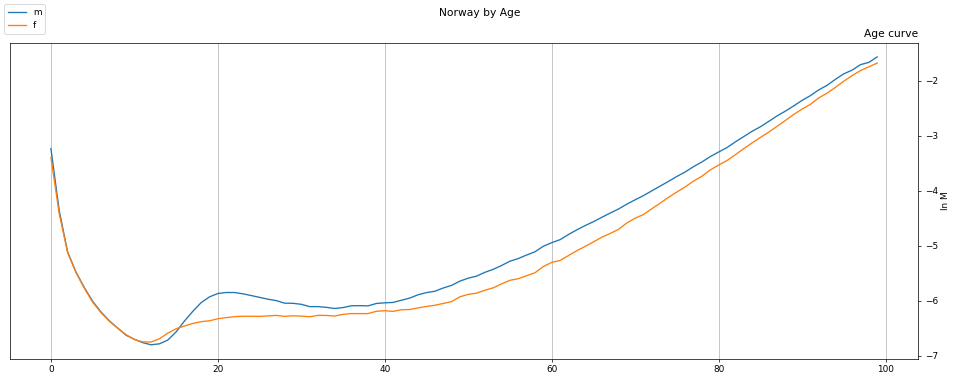
Here are the by-age curves as well, for reference (in the same order):